Tracking with Virtual Slides
View the virtual slides used in this research
Treanor, D., Lim, C. H., Magee, D., Bulpitt, A., Quirke P. (2009) Tracking with virtual slides: a tool to study diagnostic error in histopathology. Histopathology 2009 Jul;55(1):37-45.
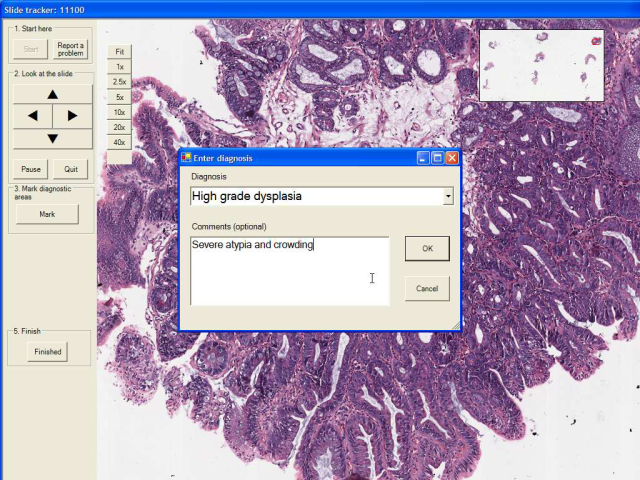
Virtual slides allow unsupervised tracking of the diagnostic process. Custom made software allows specific diagnostic tasks to be set - in this case, examining biopsies from Barrett's oesophagus for the presence of dysplasia. Pathologists are prompted to choose a diagnosis from a dropdown list, and to add a comment on their diagnosis.
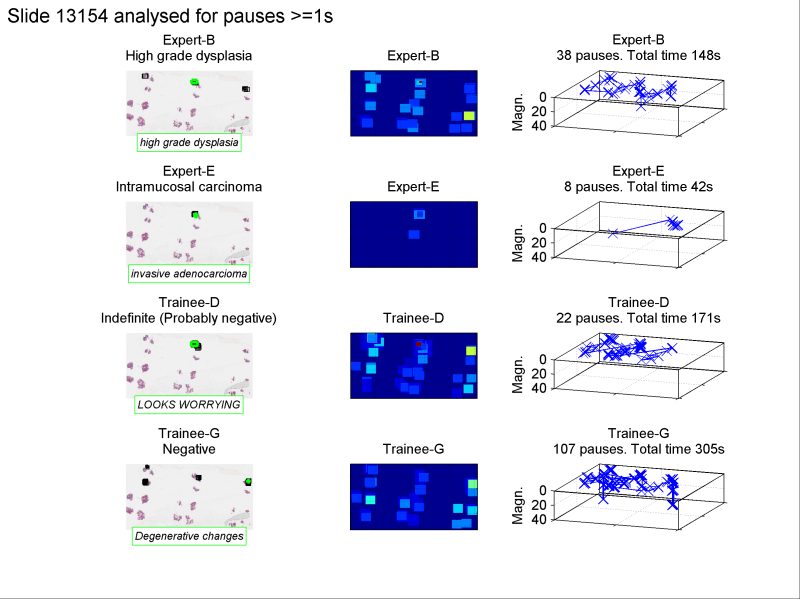
The software records their actions, and the resulting tracks can be visualised to compare pathologists performance. In the example below, a visualisation is produced by analysing tracking data for 4 pathologists viewing one case of Barrett's dysplasia.Three graphical representations of the track for each pathologist are present from left to right as follows: (a) a track superimposed on the image to indicate the path followed, (b) a heatmap generated by adding all pauses greater than 1000ms for each x and y pixel of the slide (where colour visualisations of time spent at each point were obtained by multiplying the magnification of the view by the time in seconds), (c) a 3-dimensional plot of the path in x, y, and z (zoom) dimensions.
In this case the consensus expert diagnosis is high grade dysplasia-intramucosal carcinoma. 3 subjects examined all pieces of tissue, but expert E made a rapid decision after examining just 2 pieces of tissue. Both trainees correctly identified the topmost biopsy as being abnormal, but both underestimated the seriousness of the histological changes and erroneously failed to diagnose dysplasia.